About Tableau
Tableau is a visualisation platform used by the School to create dashboards that display data as charts and tables to support decision making.
Visit the Introduction to Tableau webpage of the DTS website for further information.
Accessing Tableau dashboards
Tableau Server accounts are provided on request, so LSE staff are not automatically registered. Please see the Tableau Getting Started webpage on the DTS website for further information on how to request an account.
The video below demonstrates how to log in to Tableau Server.
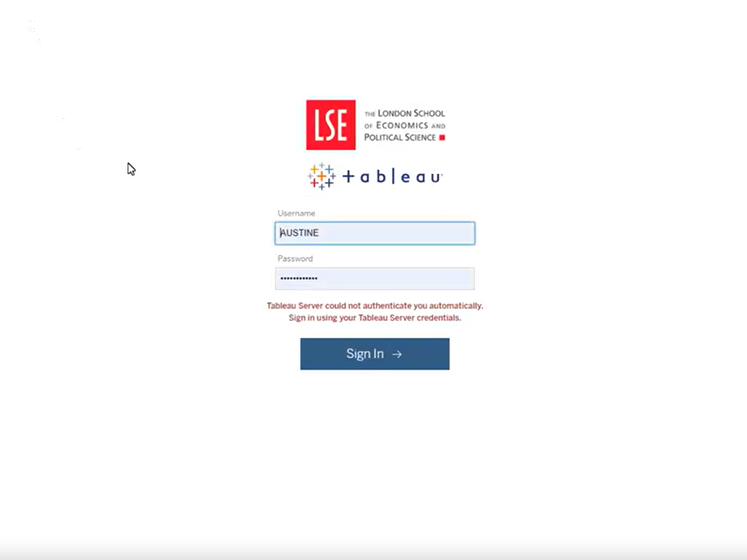 How to access Tableau
Details on how to access Tableau at LSE using the remote desktop and VPN Planning Division
How to access Tableau
Details on how to access Tableau at LSE using the remote desktop and VPN Planning Division
The following video shows how to navigate Tableau Server.
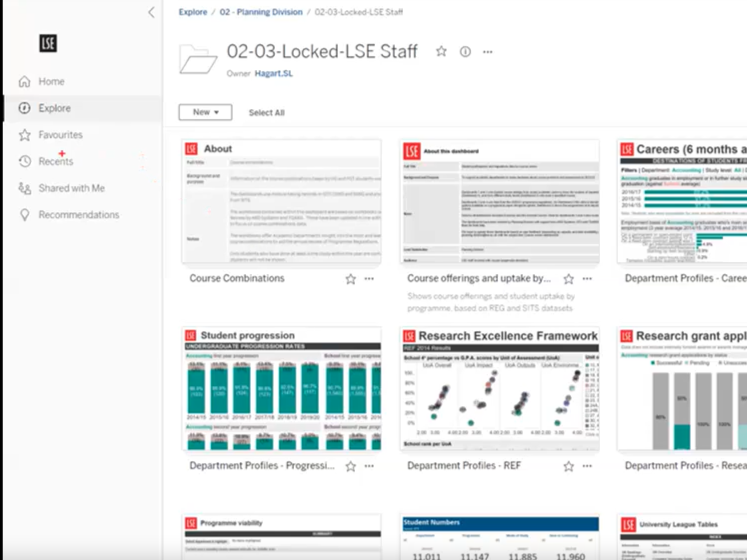 Finding and navigating content in Tableau
Information about navigating Tableau Server to find dashboards. Planning Division
Finding and navigating content in Tableau
Information about navigating Tableau Server to find dashboards. Planning Division
Navigating LSE Tableau dashboards
Tableau dashboards at LSE are designed to follow the same layout. The video below explains how to navigate one of the School's Tableau dashboards.
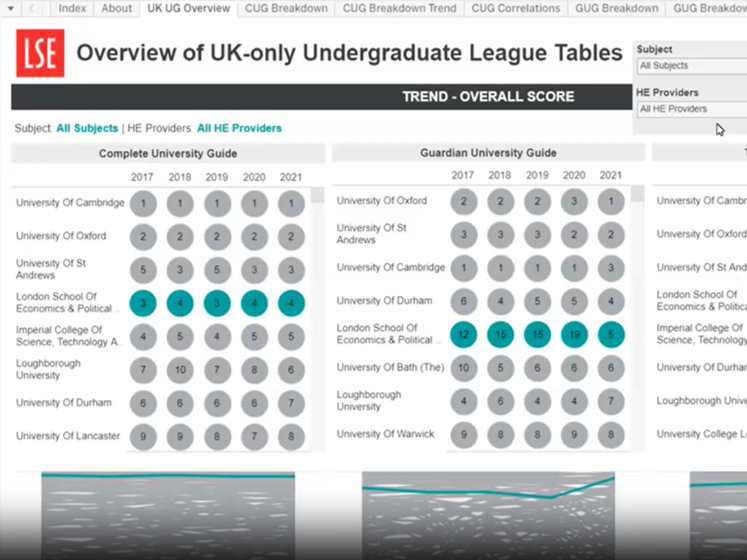 Navigating a dashboard using Tableau
Guidance on how to navigate LSE Tableau dashboards. Planning Division
Navigating a dashboard using Tableau
Guidance on how to navigate LSE Tableau dashboards. Planning Division
Support for Tableau developers
Planning Division is responsible for creating and maintaining a variety of dashboards on Tableau Server. However, dashboards are also created by a wide range of other areas across the School, such as Estates, HR, PAGE, and Sustainability.
We are also responsible for co-ordinating support for Tableau developers alongside DTS. Please see the Tableau Developer page on the DTS website for further information about the responsibilities of Tableau developers.
Data Visualisation Style Guide
The Data Visualisation Style Guide is a set of design principles for LSE Tableau developers producing data visualisations at the School. It aims to produce a consistent visual experience for end users who interact with Tableau dashboards.
The style guide was produced in Tableau in collaboration with the School’s Design Unit and a working group of Tableau developers. It has been modelled on the BBC style guide and is updated by Planning Division as new functionality and requirements are identified.
It covers accessibility guidelines, layout, and use of colour, as well as a variety of chart types. If you have any queries about the style guide, please get in touch.
Take a look at the style guide
Tableau Developers Group
Tableau developers are required to join the Tableau Developers Group, which is organised by Planning Division. The group aims to keep developers informed about changes to their responsibilities and the capabilities of the software, as well as improving the skills of the School’s developers.
The group also meets online to showcase newly created dashboards or examples of good practice, and occasionally receives training from external providers, such as the Information Lab.
Get in touch to join
Requests for new dashboards
If you have a request for a new reporting dashboard to help your department or division, please contact us.
For queries relating to a specific dashboard, please check which area of the School is responsible for the dashboard (in its about section) and contact them directly.